Youtube/Twitch Video Stuttering While Gaming Caused By Windows 10 “Game Mode”

As I mentioned in my last blog post I just recently built a new PC. It is a pretty powerful PC (9900k, 2080TI, 32GB RAM) but I noticed I had a weird issue when playing games.

When attempting to watch a Youtube video or a Twitch stream while gaming the video would stutter. Also when attempting to stream “The Division 2” Streamlabs OBS would only get ~15FPS (while the game was running at ~110FPS).

If I clicked out of the game so that it lost focus everything start running fine until the game had focus again.

After some digging I found out this was caused by Windows 10 “Game Mode”.

Disabling “Game Mode”

  1. Press the Start button, then select Settings.
  2. Choose Gaming > Game Mode.
  3. Turn Game Mode On or Off.

What does “Game Mode” do?

Microsoft lists here that Game Mode does two things:

  • Prevents Windows Update from performing driver installations and sending restart notifications.
  • Helps achieve a more stable frame rate depending on the specific game and system.

I am unsure what it exactly means by the 2nd bullet point, but I am guessing it just causes the game to run at a higher processes priority then then everything else on your system.

When I switched this off I saw no change in performance for my game, and everything started running smooth outside of it.

What else could it be?

When searching around this issue a common thing that would come up is that if you have multiple displays running at different refresh rates this could cause an issue. This was not the case for me since both of my monitors are 144hz, but could be the case for you if your monitors have different refresh rates.

Monitoring My Windows Desktop/Gaming PC With Prometheus

Last week I built a new PC for general desktop use and also for gaming. Since I am a huge monitoring nerd I wanted to get it setup in Prometheus so that I could monitor everything including temperatures (since I am doing a bit of overclocking for the first time).

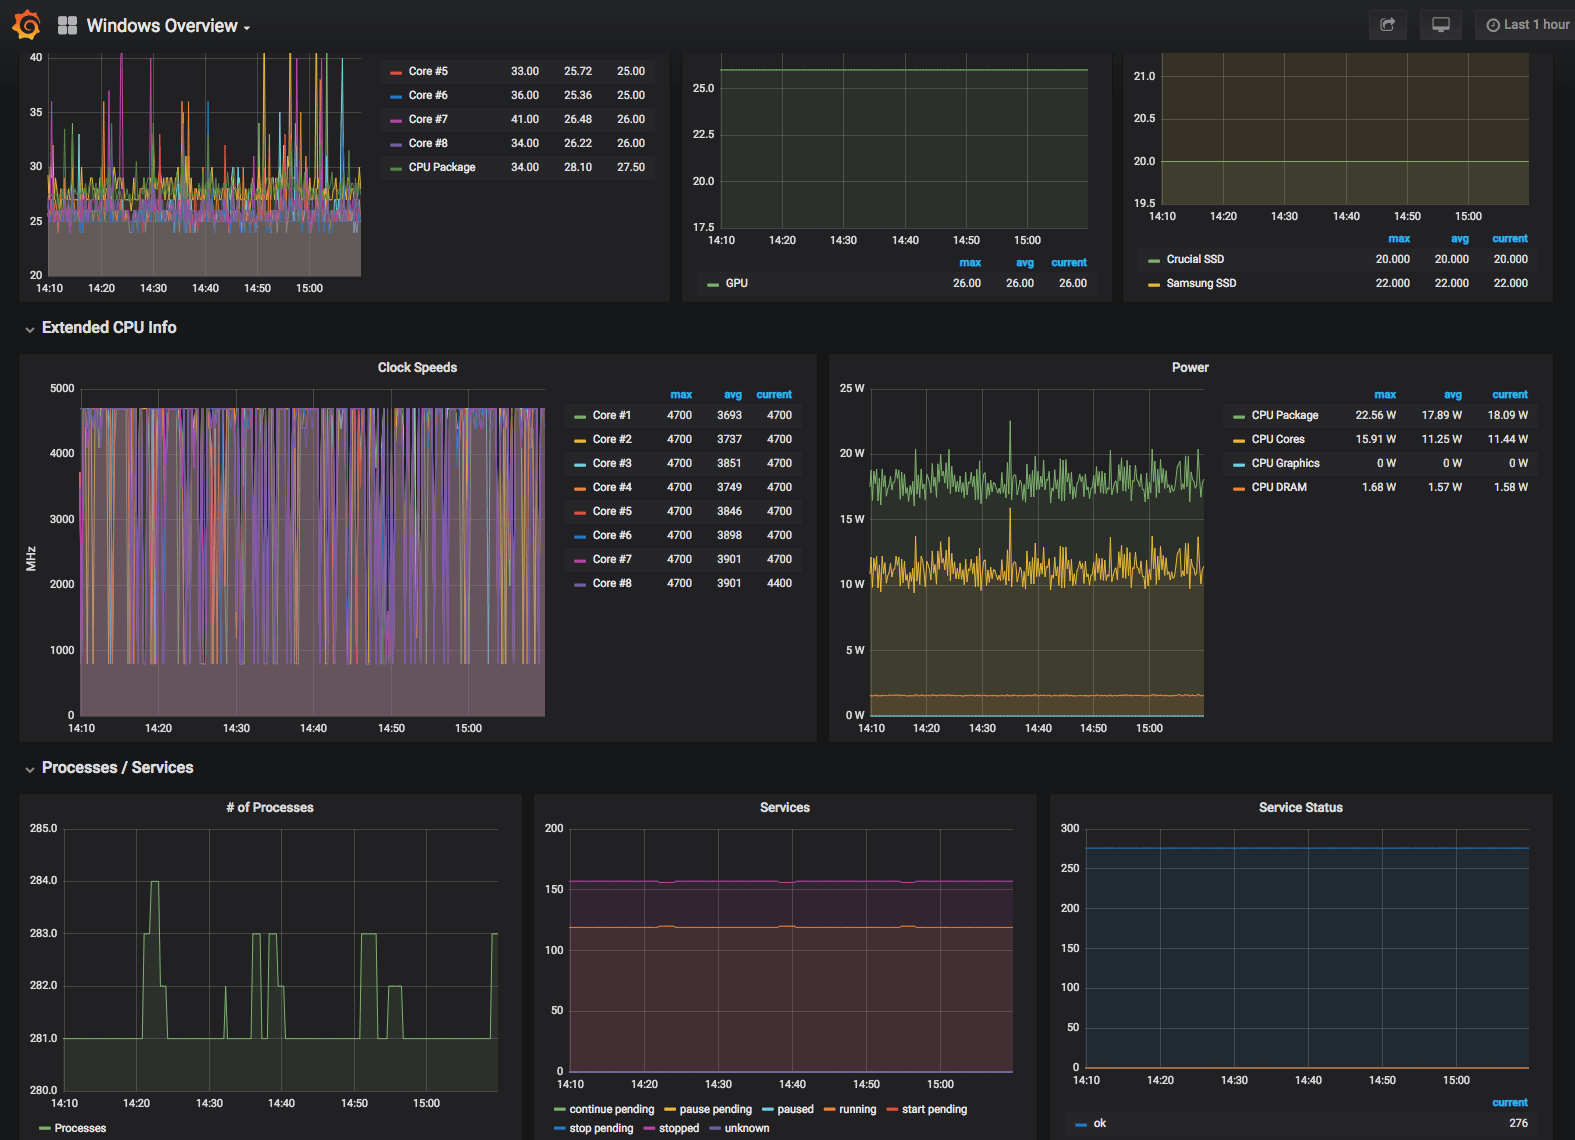
Here is a quick breakdown of the tools I am using to make this work and a live look at the Grafana dashboard.

Prometheus

I am using a standard install of Prometheus on my little home server. If you wanted to you could easily run this on your actual PC using Docker but I wanted to allow external access without opening any public access to my PC.

wmi_exporter

Most of our metrics are coming from the wmi_exporter. I am just using the default collectors it enables and that has given me most of the information I have wanted.

OhmGraphite

The one area that wmi_exporter does lack is GPU information and tempatures. Luckily OhmGraphite can pull this information for us and export it for Prometheus to read. Sadly it does not follow all the standards for metric/label naming for Prometheus so building dashboards can get a little weird. Update: This has been addressed in v0.9.0 here!

Grafana

Now to finally tie it all together and display it nicely is Grafana. I exported a copy of my dashboard here.

Live Example

Here is a live example of my dashboard up and running with actual metrics. Also some screenshots:

This was a brief overview of my monitoring setup. If you have any specific questions please feel free to reach out.