Monitoring My Windows Desktop/Gaming PC With Prometheus

Last week I built a new PC for general desktop use and also for gaming. Since I am a huge monitoring nerd I wanted to get it setup in Prometheus so that I could monitor everything including temperatures (since I am doing a bit of overclocking for the first time).

Here is a quick breakdown of the tools I am using to make this work and a live look at the Grafana dashboard.

Prometheus

I am using a standard install of Prometheus on my little home server. If you wanted to you could easily run this on your actual PC using Docker but I wanted to allow external access without opening any public access to my PC.

wmi_exporter

Most of our metrics are coming from the wmi_exporter. I am just using the default collectors it enables and that has given me most of the information I have wanted.

OhmGraphite

The one area that wmi_exporter does lack is GPU information and tempatures. Luckily OhmGraphite can pull this information for us and export it for Prometheus to read. Sadly it does not follow all the standards for metric/label naming for Prometheus so building dashboards can get a little weird. Update: This has been addressed in v0.9.0 here!

Grafana

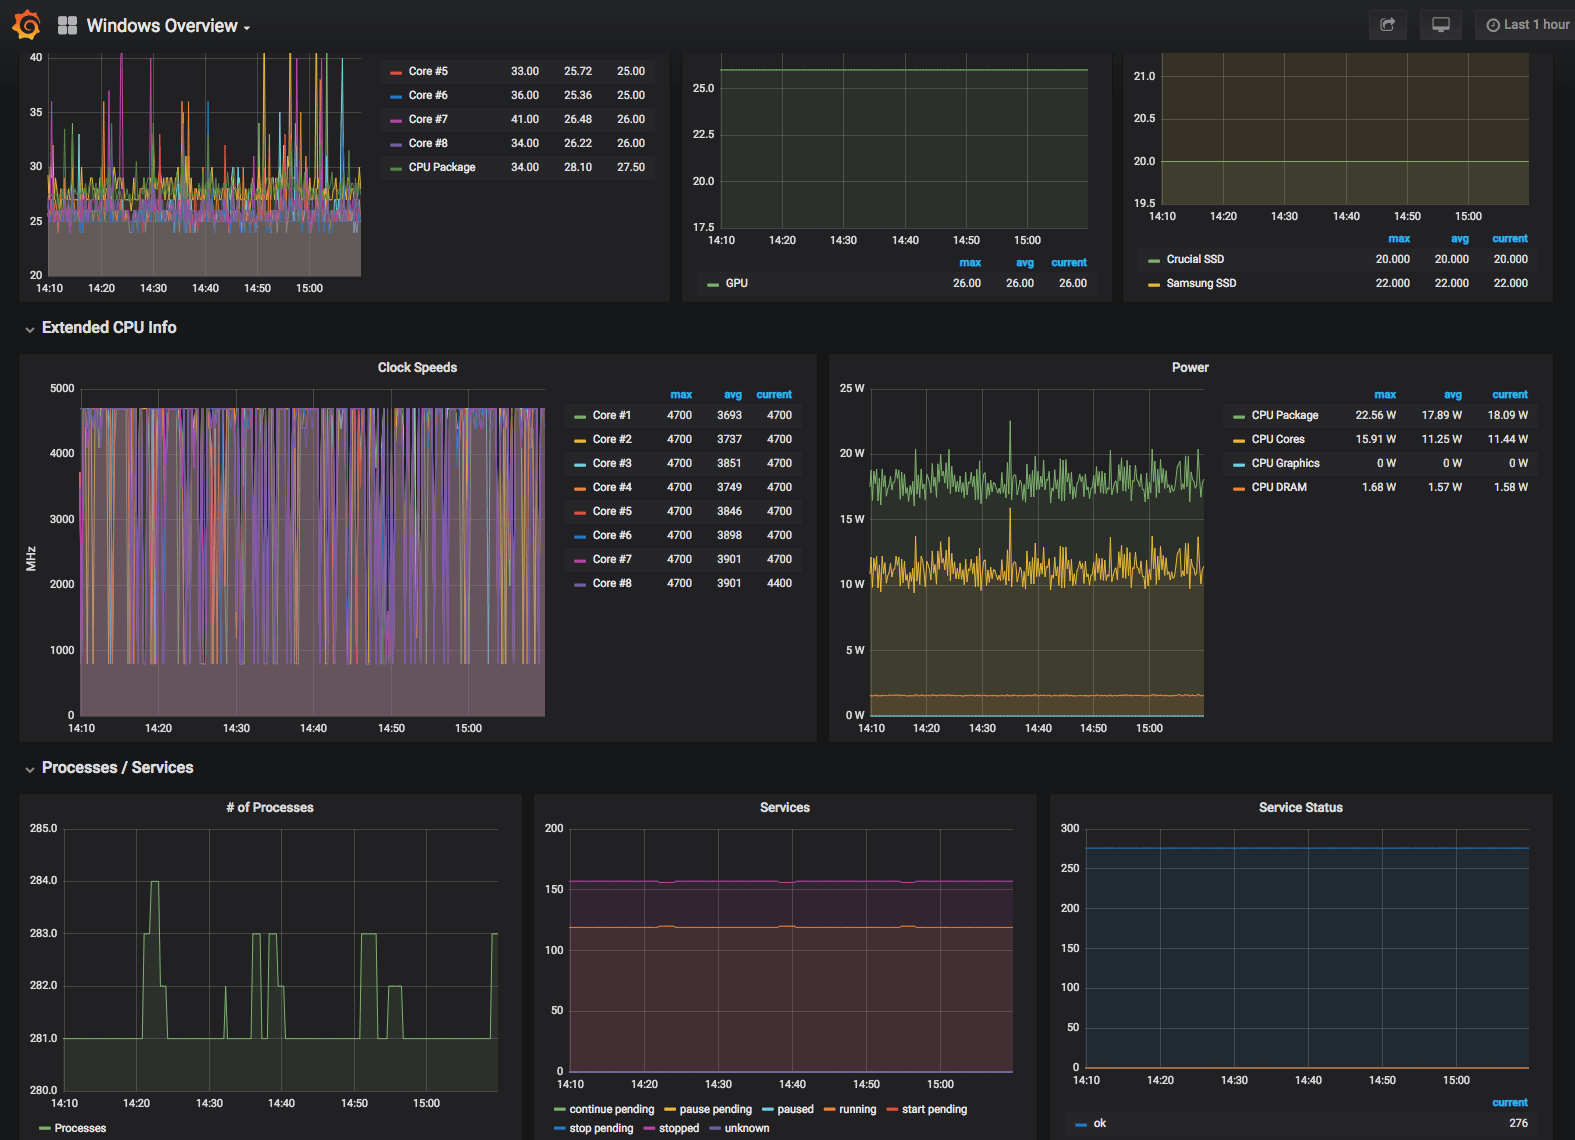
Now to finally tie it all together and display it nicely is Grafana. I exported a copy of my dashboard here.

Live Example

Here is a live example of my dashboard up and running with actual metrics. Also some screenshots:

This was a brief overview of my monitoring setup. If you have any specific questions please feel free to reach out.

Blackbox Exporter: Accessing Multiple Modules and Targets With a Single Job

In the past year I moved our teams entire infrastructure monitoring from Nagios/collectd to Prometheus. The amount of visibility into our infrastructure it has provided that we didn’t have before has been invaluable.

We host a bunch of small WordPress and other custom built websites (along with a couple very large sites) that we use the Blackbox exporter to monitor the response code and SSL Certificate status. I wanted to be able to keep all the sites we monitored in two files without having to modify the prometheus.yml every time I needed to add or remove a site which could require a reload of Prometheus.

I ended up using the file based service discovery for this. I had to dig quite a bit to find an example (which I think I found in a Github issue). Someday I want to expand this to use proper service discovery (like we do for all the other exporters) but I wanted something simple to start.

Below is examples how I have this setup in the Prometheus and Blackbox exporter configs.

1) Add the blackbox exporter job to the prometheus.yml file:

2) Then we need to configure the Blackbox Exporter on how to handle our two config files (one for http one for https):

3) Finally our last two configs. These are the actually lists of sites that the blackbox exporter will be monitoring.

That should be it. Any changes you make to either of the http_2xx.yml or https_2xx.yml config will automatically be picked up by Prometheus based on your scrape_interval setting.

Feel free to give me a shout if you have any questions or issues.