Datadog Typesense Custom Agent Check

At Misfits Market we recently moved from a combination of a self hosted Prometheus/Loki/Grafana setup, along with some other external tools to Datadog as our all in one monitoring platform.

While Datadog offers 500+ builtin integrations, there will be the occasional service that you use that won’t be covered. Luckily it is fairly easy to write a custom agent check (or even a full on integration).

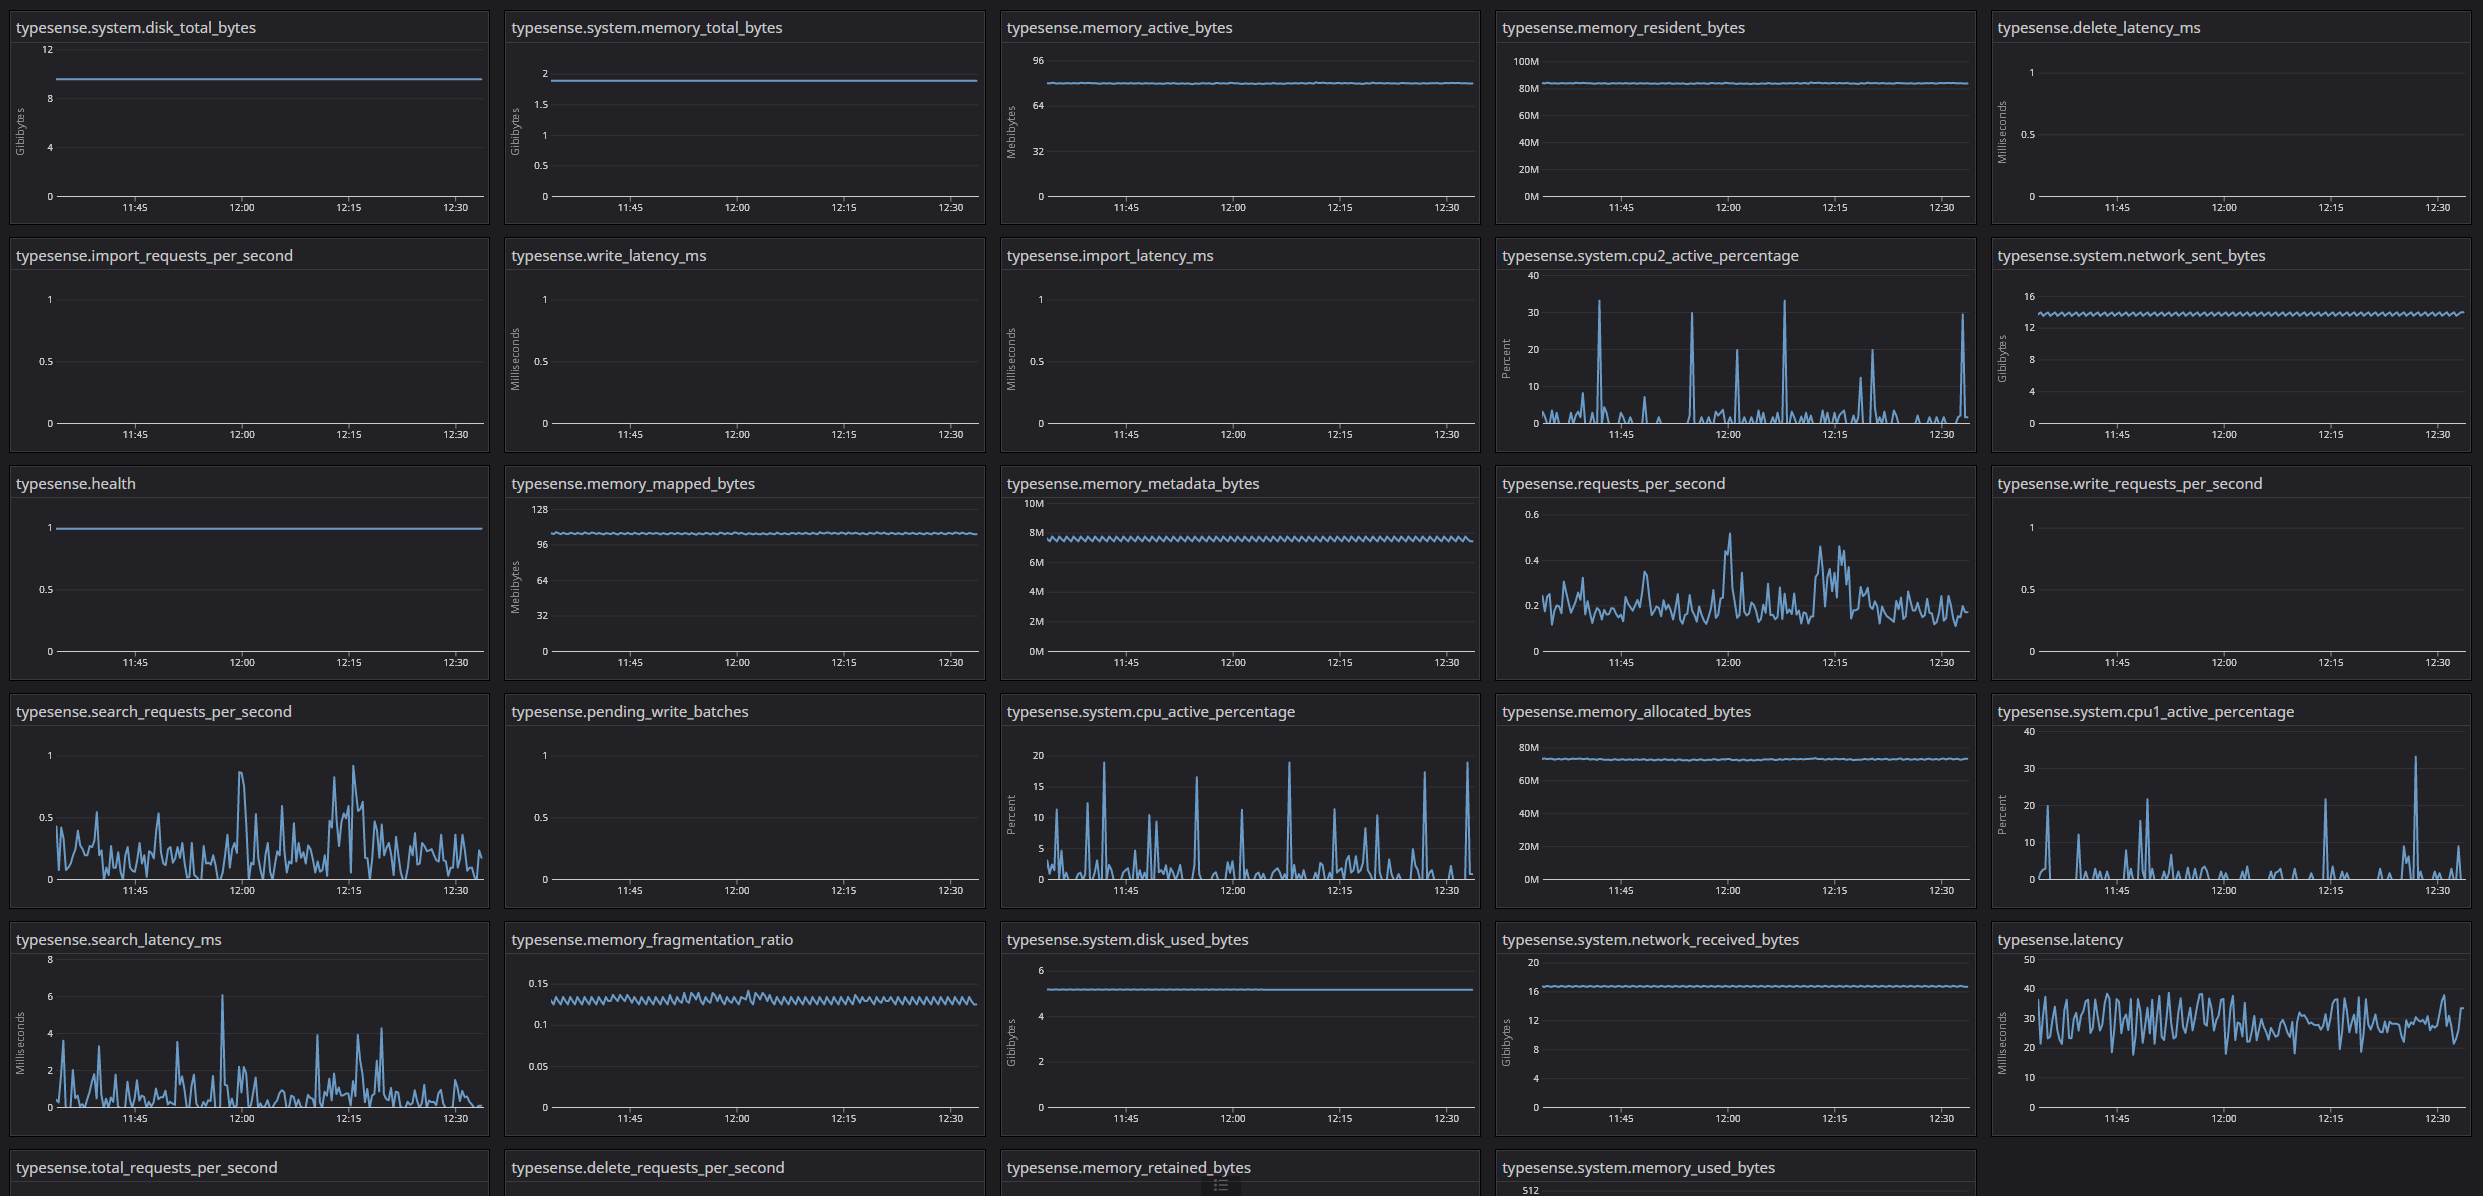
One integration we were missing was for our search engine Typesense. So I put together a quick custom agent check. I would like to possibly write an actual integration for it someday but I just wanted to get something off the ground quickly.

You can find it on Github here.

Install

Check Location

Upload the check script typesense.py to /etc/datadog/checks.d/typesense.py.

Configure

Create a configuration file located at /etc/datadog/conf.d/typesense.yaml. Check typesense.yaml in the repo as an example.

Screenshot

Example of some of the metrics.

Monitoring My Windows Desktop/Gaming PC With Prometheus

Last week I built a new PC for general desktop use and also for gaming. Since I am a huge monitoring nerd I wanted to get it setup in Prometheus so that I could monitor everything including temperatures (since I am doing a bit of overclocking for the first time).

Here is a quick breakdown of the tools I am using to make this work and a live look at the Grafana dashboard.

Prometheus

I am using a standard install of Prometheus on my little home server. If you wanted to you could easily run this on your actual PC using Docker but I wanted to allow external access without opening any public access to my PC.

wmi_exporter

Most of our metrics are coming from the wmi_exporter. I am just using the default collectors it enables and that has given me most of the information I have wanted.

OhmGraphite

The one area that wmi_exporter does lack is GPU information and tempatures. Luckily OhmGraphite can pull this information for us and export it for Prometheus to read. Sadly it does not follow all the standards for metric/label naming for Prometheus so building dashboards can get a little weird. Update: This has been addressed in v0.9.0 here!

Grafana

Now to finally tie it all together and display it nicely is Grafana. I exported a copy of my dashboard here.

Live Example

Here is a live example of my dashboard up and running with actual metrics. Also some screenshots:

This was a brief overview of my monitoring setup. If you have any specific questions please feel free to reach out.